plot_rohani
plot_rohani.RmdPlotting Infectious Disease Time-Series
(Disclaimer – I have not yet read very much about visualization of
specifically epidemiological data, so I am likely treating this topic
very naively. The point of this document is to start a discussion and
make a start on specifications for plotting functions in
iidda.analysis)
Example Data
Throughout we will use communicable disease incidence data from Canada in 1956.
library(iidda.api)
raw = iidda.api::ops_staging$raw_csv(dataset_ids = "cdi_ca_1956_wk_prov_dbs")
## Now converting some fields from character to numeric or date.
## You can turn this off with
## options(iidda_api_all_char = TRUE).
## Do not display any iidda.api messages with
## options(iidda_api_msgs = FALSE).
## Messages displayed at most once per R session.## Now sorting by date.
## You can turn this off with
## options(iidda_api_date_sort = FALSE).
## Do not display any iidda.api messages with
## options(iidda_api_msgs = FALSE).
## Messages displayed at most once per R session.## Warning: 947 parsing failures.
## row col expected actual
## 27 -- a number Not reportable
## 38 -- a number Not reportable
## 39 -- a number Not reportable
## 49 -- a number Not reportable
## 50 -- a number Not reportable
## ... ... ........ ..............
## See problems(...) for more details.## Warning: 1205 parsing failures.
## row col expected actual
## 10 -- a number Not reportable
## 27 -- a number Not reportable
## 38 -- a number Not reportable
## 39 -- a number Not reportable
## 49 -- a number Not reportable
## ... ... ........ ..............
## See problems(...) for more details.## Warning: 1208 parsing failures.
## row col expected actual
## 9 -- a number Not reportable
## 10 -- a number Not reportable
## 27 -- a number Not reportable
## 38 -- a number Not reportable
## 39 -- a number Not reportable
## ... ... ........ ..............
## See problems(...) for more details.
raw## # A tibble: 16,016 × 15
## cases_cum_median_prev_5_years cases_cum_prev_year cases_cum_report_year
## <dbl> <dbl> <dbl>
## 1 1415 921 927
## 2 NA NA NA
## 3 NA NA NA
## 4 NA NA NA
## 5 NA NA NA
## 6 NA NA NA
## 7 NA NA NA
## 8 NA NA NA
## 9 NA NA NA
## 10 NA NA NA
## # ℹ 16,006 more rows
## # ℹ 12 more variables: cases_median_prev_5_years <dbl>,
## # cases_prev_period <dbl>, cases_this_period <dbl>, digitization_id <chr>,
## # historical_disease <chr>, historical_disease_subclass <chr>,
## # location <chr>, location_type <chr>, period_end_date <date>,
## # period_start_date <date>, scan_id <chr>, time_scale <chr>Our focal example within these data are for weekly measles counts broken down by province.
##
## Attaching package: 'dplyr'
## The following objects are masked from 'package:stats':
##
## filter, lag## The following objects are masked from 'package:base':
##
## intersect, setdiff, setequal, union
measles = (raw
  %>% filter(tolower(historical_disease) == "measles")
  %>% filter(time_scale == "wk", location_type == "province")
  %>% select(location, period_start_date, cases_this_period)
  %>% mutate(period_start_date = as.Date(period_start_date))
  %>% mutate(cases_this_period = as.numeric(cases_this_period))
)
measles
## # A tibble: 520 × 3
## location period_start_date cases_this_period
## <chr> <date> <dbl>
## 1 NFLD. 1956-01-01 55
## 2 P.E.I. 1956-01-01 69
## 3 N.S 1956-01-01 86
## 4 N.B. 1956-01-01 0
## 5 QUE. 1956-01-01 95
## 6 ONT. 1956-01-01 1188
## 7 MAN. 1956-01-01 11
## 8 SASK. 1956-01-01 1
## 9 ALTA. 1956-01-01 47
## 10 B.C. 1956-01-01 22
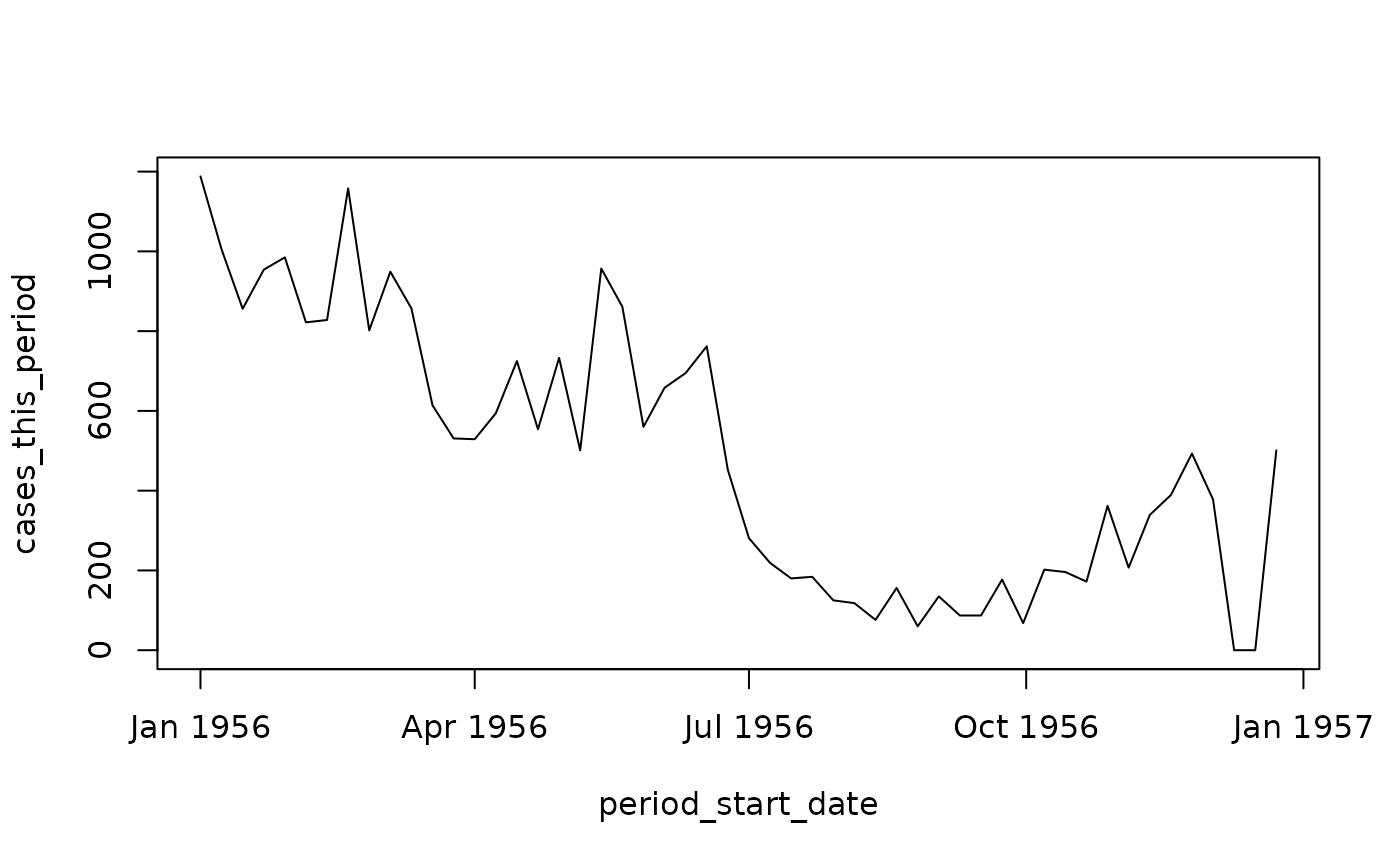
## # ℹ 510 more rowsTo get a sense of these data, here is the plot for the province of Ontario.

Generalizing Rohani, Earn, and Grenfell
Rohani, Earn, and Grenfell (1999) developed a method for plotting time series of cases of a disease, broken down by geographic location. The geographic locations are ordered along one of the y-axes of the plot by population size. We generalize this plot by allowing geographic location to be any ordinal grouping variable. We additionally generalize by allowing cases to be any positive variable that can be meaningfully summed over the observed times within the levels of the grouping variable.
A data structure that would contain all of the information required to make such a plot consists of two tables; one for the generalized cases variable (call it the series data) and one for the generalized geographical location variable (call it the grouping table). For our measles data we can get the series
With this generalization one could construct a function to produce these plots.
##' Plot Rohani Diagram
##'
##' @param series_col Name of column in \code{data_series} giving the numerical
##' variable of interest (e.g. numbers of cases).
##' @param time_col Name of column in \code{data_series} giving a date-time
##' variable to plot on the x-axis.
##' @param grouping_col Name of column in both \code{data_series} and
##' \code{data_groups} giving the labels of the grouping variable. This
##' variable will be unique in \code{data_groups}, but will be repeated in
##' \code{data_series} over the different time periods.
plot_rohani = function(
  series_col,
  time_col,
  grouping_col,
  ranking_col,
  data_series,
  data_groups
)
Note that we are assuming that the
TODO: these graphs: https://ms.mcmaster.ca/earn.old/pdfs/KrylEarn2020_PLoSBiology_SmallpoxLondon.pdf and these https://ms.mcmaster.ca/earn.old/pdfs/Tien+2011_JRSI_CholeraHeraldWaves.pdf